Project Scale
450K+
Combined rows across portfolio projects, designed to reflect larger analytical workloads.
I am a Data Analyst with a strong interest in retail, supply chain, and financial analysis. I have hands-on experience working in retail and have built projects using Excel, SQL, Python, and Power BI to better understand sales performance, inventory behavior, and business trends.
Combined rows across portfolio projects, designed to reflect larger analytical workloads.
Business-driven case studies built around decision support, operational insight, and reporting clarity.
Hands-on retail experience combined with data analysis projects in sales, inventory, and financial performance.
These projects focus on practical analysis such as sales performance, financial trends, and data processing. Each one includes a dashboard view, key findings, and simple explanations to clearly show how the data is used to understand business performance.
In this project, I analyzed revenue, costs, and profit margins to understand how business performance changes over time. I also compared actual expenses with budget to identify where costs were higher than expected.
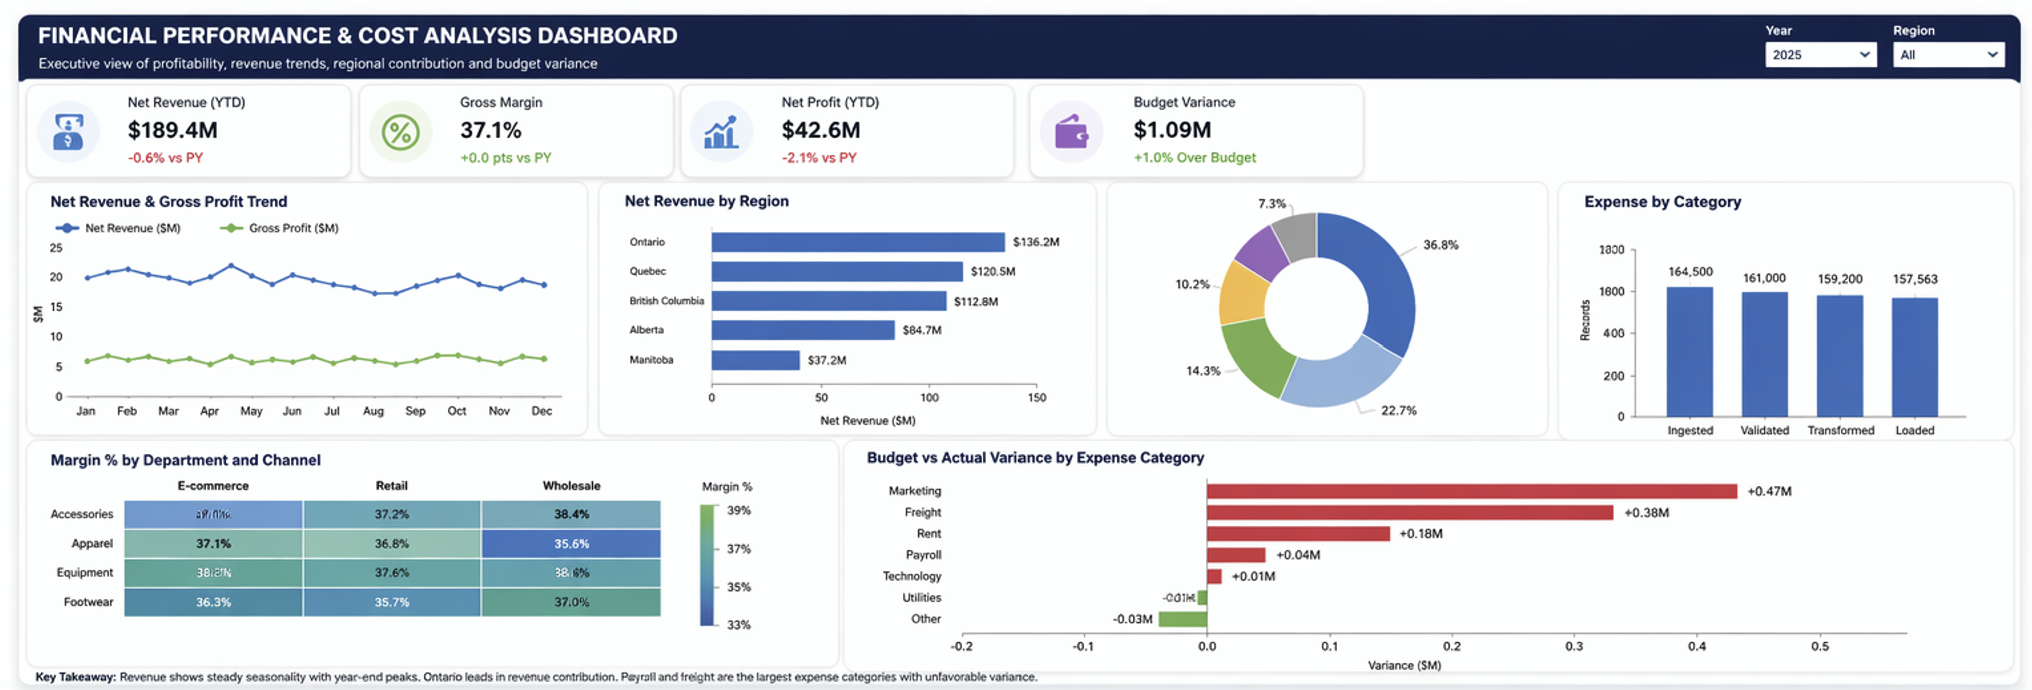
Tracks the total value generated after core deductions and helps show topline performance.
Shows how efficiently revenue is converted into gross profit.
Helps compare current performance with prior periods and targets.
Highlights where actual spending is above or below budget expectations.
In this project, I analyzed retail sales data to understand product performance, customer behavior, and seasonal trends. This helped me connect real retail experience with data analysis.
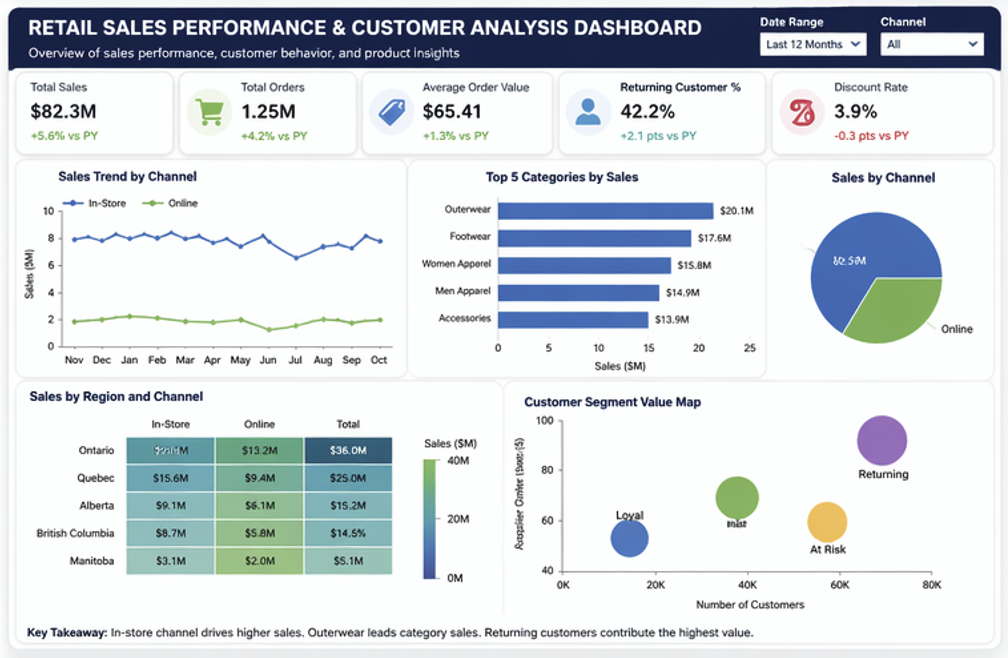
Shows recent commercial momentum and short-term performance changes.
Helps estimate customer spending behavior at transaction level.
Shows retention strength and repeat purchase behavior.
Helps assess promotional intensity and margin pressure.
In this project, I built a simple data pipeline to clean and prepare raw data for analysis. I focused on improving data accuracy and making the data ready for reporting.
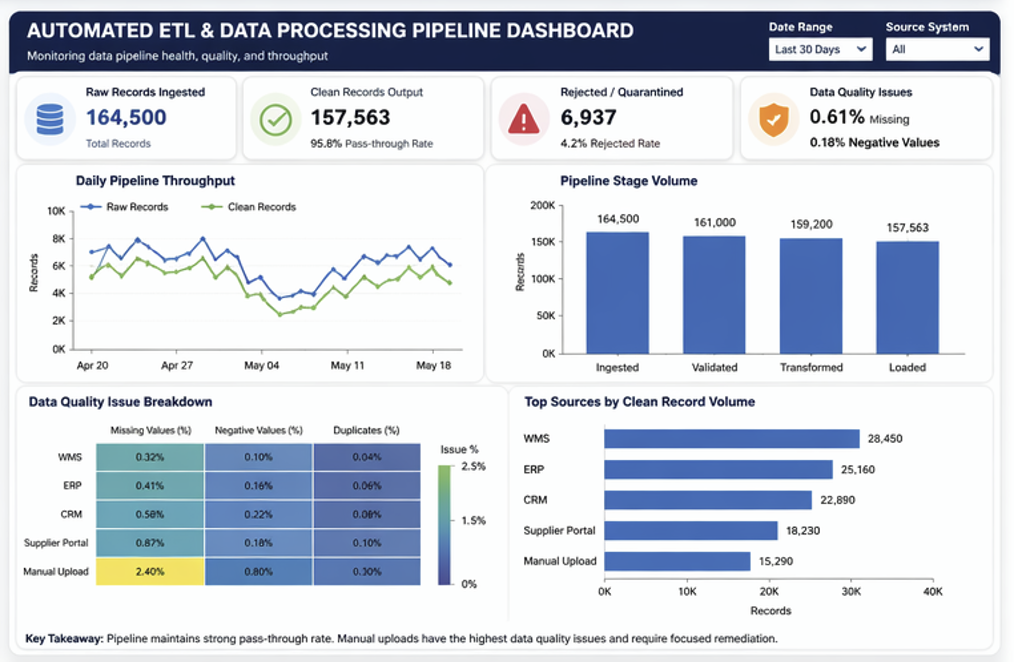
Measures the incoming data volume from all source systems.
Shows the number of validated records ready for reporting or downstream use.
Highlights validation failures that need investigation or correction.
Summarizes recurring issue types such as missing, duplicate, or invalid values.
My resume is tailored for Data Analyst, Replenishment Analyst, Supply Chain Analyst, and Financial Analyst opportunities, with a strong focus on business-relevant projects and practical analytics skills.
My cover letter connects retail operations experience with analytical thinking, project-based work, and a clear motivation to contribute in an entry-level analyst role.